
Cricket Guides · 5 min read · English
Batting average and strike rate answer different questions. Average is runs scored per dismissal. Strike rate is runs scored per 100 balls faced. Use average to understand scoring across dismissals; use strike rate to understand scoring pace. Neither number tells the whole story on its own.
The difference is useful when you compare innings or players. A batter can have a high strike rate in a short, attacking innings and still have a low average. Another can build a large average through not-outs while scoring more slowly. Format, role, match situation and sample size all matter.
On This Page
- How to Calculate Batting Average
- How to Calculate Strike Rate
- Read the Numbers Together
- Common Reading Mistakes
- Where Fours & Sixes Fits
- Questions Players Ask
- Related Guides
- Further Reading
How to Calculate Batting Average
Add the batter’s runs, then divide by the number of times they were dismissed:
Batting average = total runs ÷ dismissals
Do not divide by the number of innings played. A not-out innings adds runs but does not add a dismissal to the denominator. If a batter has not been dismissed in the records being counted, their average is undefined because there is no denominator. It is not a zero average.
Example: Including a Not-Out
Imagine a player has scores of 34, 12, 0 and 28 not out. Their total is 74 runs in four innings, but they were dismissed three times. Their average is 74 ÷ 3, or 24.67 to two decimal places. Dividing by four innings would give 18.5, which answers a different question and is not the batting average.
How to Calculate Strike Rate
Divide runs scored by balls faced, then multiply by 100:
Batting strike rate = runs scored ÷ balls faced × 100
A strike rate of 125 means 125 runs per 100 balls faced at the same scoring pace. It does not mean the batter actually faced 100 balls. Use the balls-faced total recorded under your competition’s scoring conventions; do not treat a displayed overs figure as the batter’s balls faced.
Example: Runs at a Faster Pace
If a batter scores 30 runs from 20 balls, the calculation is 30 ÷ 20 × 100 = 150.0. If another scores 30 from 40 balls, the strike rate is 75.0. Both scored the same number of runs, but at different rates.
If the scorecard has no balls-faced data, you cannot calculate a reliable strike rate from the score alone. Do not guess the missing denominator.
Read the Numbers Together
Consider two illustrative innings:
| Batter | Runs | Balls faced | Dismissals in the sample | Average | Strike rate |
|---|---|---|---|---|---|
| A | 40 | 20 | 1 | 40.00 | 200.0 |
| B | 60 | 60 | 1 | 60.00 | 100.0 |
B has the higher average in this small sample: 60 runs per dismissal compared with 40. A scored much faster in the innings shown. That does not make A the better batter in every role. A late-innings hitter may be asked to score quickly; an opener may need to protect wickets and build a platform. The match situation changes what “useful” looks like.
For a fairer comparison, check whether the figures cover similar formats, roles and periods. A short run of matches can swing sharply after one innings. A career total can also hide a recent change in form. If the scorecard includes not-outs, make sure they are treated consistently in the average. If the ball count is missing or recorded under a different convention, keep that limitation visible. When you compare seasons, use the same date range and competition level for both players. When you compare an innings, include the target and wickets remaining: a chase can reward a faster pace, while a side setting a total may value a batter who stays in.
Common Reading Mistakes
- Using innings instead of dismissals. Average uses times out, not appearances.
- Calling a not-out average zero. With no dismissals, the denominator is zero, so the average is undefined.
- Treating a strike rate as a prediction. It summarises the recorded sample; it does not promise a future scoring pace.
- Comparing unrelated roles. The number alone does not account for batting position, target, wickets in hand or format.
- Ignoring missing data. A blank or unavailable ball count is not a zero-ball innings. Check what the scorecard actually recorded.
To see where these figures sit alongside batting and bowling columns, read What a Cricket Scorecard Tells You or visit the Match Centre guide. For a related bowling comparison, see Bowling Economy Rate vs Bowling Average.
Where Fours & Sixes Fits
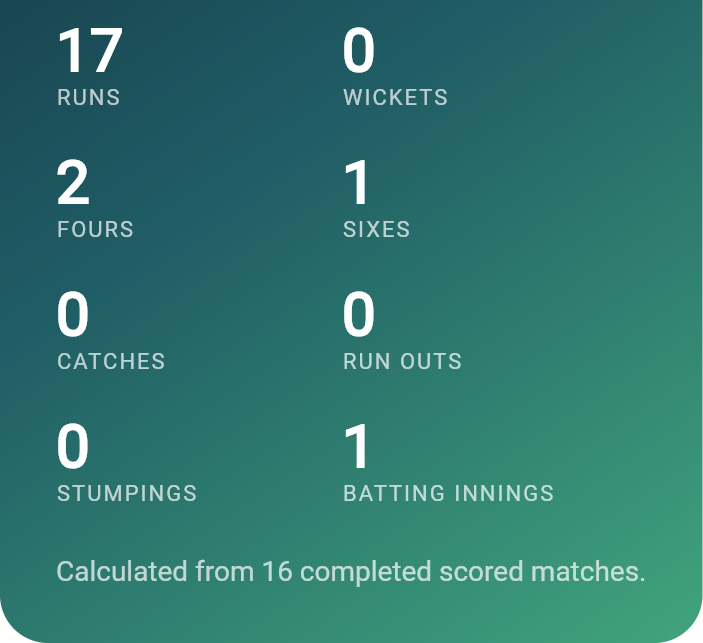
Fours & Sixes calculates core figures from recorded match data. Its Analysis feature offers career and innings insights with Pro; the basic comparison of recorded career statistics is available without Pro. Recent-form comparison charts and Face-Off are Pro features. Insights depend on completed matches linked to the relevant player identity.
Questions Players Ask
Is Batting Average More Important Than Strike Rate?
Neither is universally more important. Average describes runs per dismissal; strike rate describes scoring pace. The role, format and match situation explain what a particular figure means.
Does a Not-Out Score Count Towards Batting Average?
The runs count in the total, but the not-out does not add a dismissal. Divide the runs by times dismissed, not innings played.
What If the Batter Has Not Been Dismissed?
Their average is undefined for that sample because the number of dismissals is zero. Report the runs and not-outs clearly rather than replacing the average with zero.